Point chart
Updated: 10/02/2017 by Computer Hope
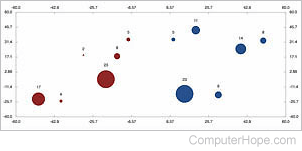
A point chart is a graphic chart comprised of various points (or dots) that commonly represent a large quantity of data and can locate trends or averages.

A point chart is a graphic chart comprised of various points (or dots) that commonly represent a large quantity of data and can locate trends or averages.