
Flowchart
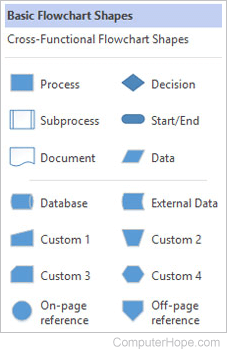
A flowchart is a graphical representation of decisions and their results mapped out in individual shapes that were developed by Herman Goldstine and John von Neumann in the 1940s. Flowcharts can provide a step-by-step diagram for mapping out complex situations, such as programming code or troubleshooting problems with a computer. To the right, is an image from Microsoft Visio, a popular program used to design and create flowcharts and diagrams.
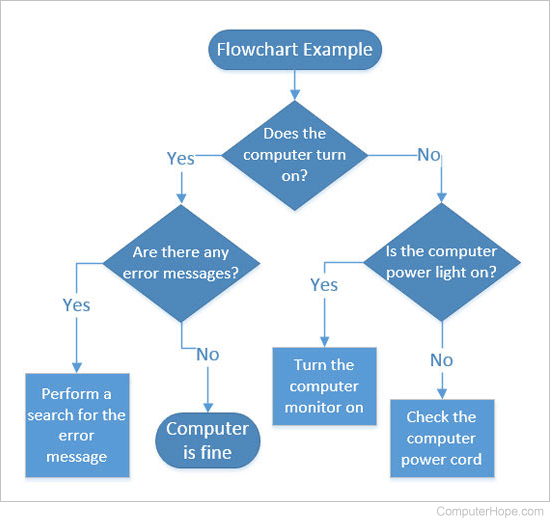
Below is an example of a basic flowchart created in Visio that gives a good representation of their layout. As shown, you have several steps followed systematically to help determine what's causing the computer problem. Of course, this is an example and not the full set of steps required to troubleshoot computer issues.
Other examples of how flow charts are used
Flowcharts can also be created for any of the situations below.
- Algorithm - List the steps of how an algorithm works.
- Audit - Give the steps required to test a system or process with steps to handle any problems.
- Procedure - List the steps for completing any procedure to help verify everything is done right the first time and every time.
- Program - Steps to create or use a program.
- Projects - Give an overview of the steps required for creating a new project or the steps to complete the project.
- Troubleshooting - List the steps involved for troubleshooting a problem, like the example listed earlier.
Algorithm, Block diagram, Business terms, Chart, Concept mapping, Decision box, Diagram, ERD, Example, Graphic character, Message sequence chart, Pseudocode, Schema, Visio