Chart area
Updated: 09/15/2017 by Computer Hope

A chart area may refer to any of the following:
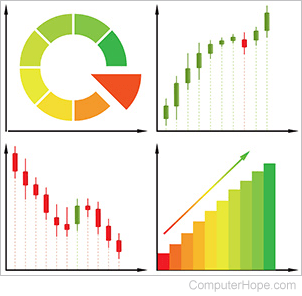
1. In some software interfaces for Microsoft Silverlight, like the Telerik UI (user interface), the Chart area, or ChartArea, is the boundary where a chart is rendered. It includes the RadChart control, X-axis, and Y-axis. The ChartArea also makes programming events and interactive abilities available for customizing the chart or graph tooltips.
2. In general, the chart area in a document or spreadsheet contains the chart, graph, and headers of the graph. It also contains a legend, providing information on the various lines or colors in the chart. The chart area is usually, but not always, delimited by a bold outline to separate it visually from other text or images in a document.
