
Graph
Graph may refer to any of the following:
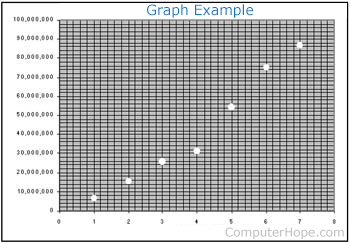
1. Not to be confused with a chart, a graph (/graf/) represents of connected values in a multidimensional space. Graphs are useful for analyzing the various connections between individual units of data.
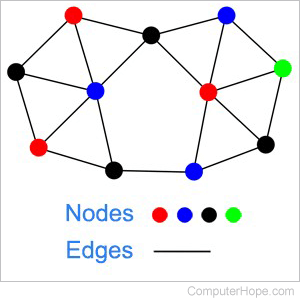
2. In mathematics, graphs are an important computational tool. Graph values are called nodes, and their connections are called edges. Graphs may be "directed" (traversal between nodes can happen only in one direction) or "undirected" (either direction may be traversed from node to node).
When performing a graph search, the algorithm is finding the shortest path from one node to another node. To do this, an algorithm looks at the weight of each path on a graph to find the most optimized path.
Graphs have important applications in networking, search engines, social network analysis, and recommendation systems, such as those used by Amazon, Netflix, Pandora, Spotify, and YouTube.
One of the most famous graph analysis algorithms is PageRank, which is used by Google to generate search results.
The scientific study of graphs and their analysis is called graph theory.