
Gantt chart
Updated: 10/07/2019 by Computer Hope
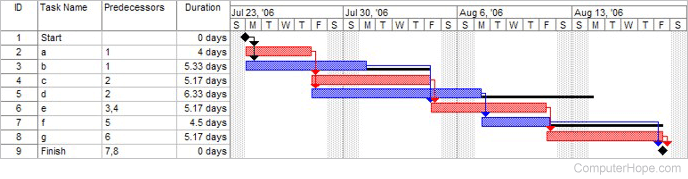
A Gantt chart is a type of chart that helps visualize a schedule for a project. Each task of the project is listed in the vertical axis, and days, weeks, or months are listed in the horizontal axis. The Gantt chart shows a bar for each task, with the length of the bar corresponding to the start and end week or month.
The completion percentage of each task may be listed next to the bar for each task. A vertical line may be used in a Gantt chart to show the current date and whether tasks are being completed on time.
Gantt charts are used by project managers to provide a better view of a project's progress and when tasks need to be completed. Microsoft Project is a popular program used to build, present, and share Gantt charts.