
How to create a chart or graph in Excel, Calc, or Sheets
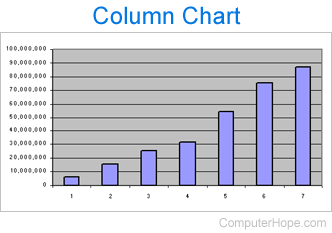
Charts and graphs help illustrate important information needing to be conveyed to other people. Common examples of data displayed in a chart are sales information for a month or year, or showing trends in the stock market.
To create or edit a chart or graph in Microsoft Excel, LibreOffice Calc, or Google Sheets, select a link below and follow the provided steps.
Create a chart in Microsoft Excel
To create or plot a chart in a Microsoft Excel worksheet, follow the required steps below for your version of Excel.
Excel 2007 and later
- Open Microsoft Excel and create a new spreadsheet or open an existing spreadsheet where you want to add a chart.
- Highlight the cells containing the data you want to use to create the chart. For example, to chart the sales data listed in cells A20 through J20, you would highlight A20 through J20.
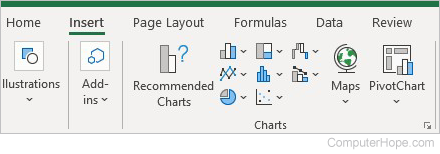
- In the Ribbon, click the Insert tab.
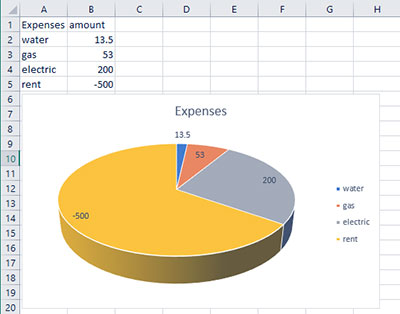
- In the Charts section, select the type and style of chart you want to create. Examples of charts are pie, waterfall, and column. The chart below, for example, is a 3-D pie chart. The type of chart is pie, and 3-D is the style of chart. Once added, you can modify the style and color, add or remove chart elements, and filter the data displayed in the chart.
Excel 2003 and earlier
- Open Microsoft Excel and create a new spreadsheet or open an existing spreadsheet where you want to add a chart.
- Highlight the cells containing the data you want to use to create the chart. For example, to chart the sales data listed in cells A20 through J20, you would highlight A20 through J20.
- Click the Insert menu at the top of the Excel program window.
- Select Chart in the Insert menu to open the chart wizard. The chart wizard steps you through the process to create a chart, including the types you want to use, the title, axis, legends, etc.
Create a chart in LibreOffice Calc
- Open LibreOffice Calc, then create a new spreadsheet or open an existing spreadsheet where you want to add a chart.
- Highlight the cells containing the data you want to use to create the chart. For example, to chart the sales data listed in cells A20 through J20, you would highlight A20 through J20.
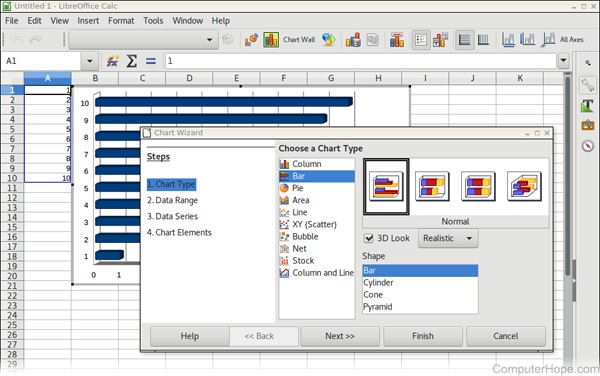
- Click the Insert menu at the top of the Calc program window.
- Select Chart in the Insert menu to open the chart wizard. The chart wizard steps you through the process to create a chart, including the types you want to use, the title, axis, legends, etc.
Create a chart in Google Sheets
- Go to the Google Sheets website at sheets.google.com.
- Open or create a spreadsheet.
- Select the range of cells with the desired data.
- Select Insert from the menu bar.
- Select Chart.
- Use the Chart editor to change the chart type, and customize aspects of the chart.
Edit an existing chart
If a chart already exists in the spreadsheet you are editing, you can change its layout or properties by double-clicking the portion of the chart you want to edit. For example, double-clicking a chart lets you customize the colors, lines, and background values of the chart.