
Trendline
Updated: 03/10/2024 by Computer Hope
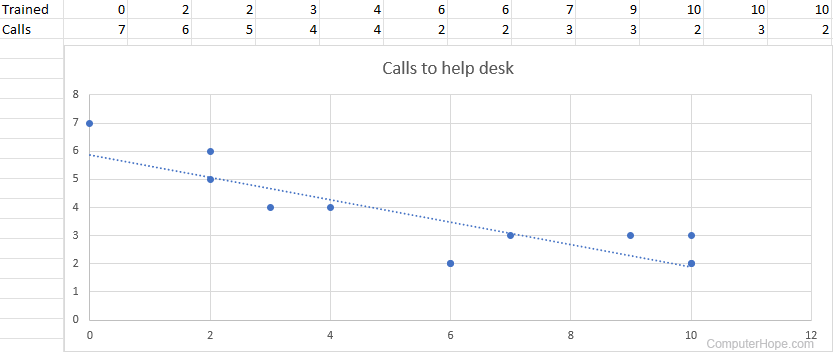
A trend line or trendline is a line or other object that indicates the general direction of something (e.g., the points on a scatter chart). In the following chart, the dotted line indicates the downward trend of calls received by a help desk in a scattered chart.
How to add a trendline in Excel
To add a trendline to a Microsoft Excel chart, click a chart, and in the top-right corner, click the green plus (shown below).
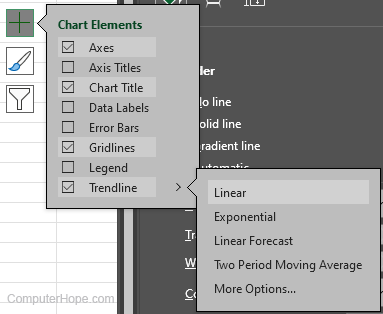
After clicking the green plus, select Trendline to fill in the check box next to the option. To adjust the trendline, hover over Trendline, and click the chevron to get the following options:
- Linear - Default trendline that is straight in nature.
- Exponential - A trendline with an increasing or decreasing degree of curvature.
- Linear Forecast - Trendline with an extended forecast based on previous values.
- Two Period Moving Average - Trendline that may have more of a jagged shape based on the two previous points.
- More Options - Opens the Format Trendline section with additional trendline options, including Logarithmic, Polynomial, and Power. Also allows other trendline values and appearances to be adjusted, such as the line type, width, and color.