
How to create a chart or graph in Microsoft Word
In Microsoft Word, not only can you create documents with text and insert pictures into documents, but you can also create a chart or graph to add visual detail to documents.
Adding a chart or graph is only possible in the Microsoft Word desktop application (Word 365 and earlier versions). The feature is not currently supported in Microsoft Word Online (the web version).
There are two options for creating a chart or graph in Microsoft Word. Click a link below for details on how to use each option.
Create chart or graph directly in Microsoft Word
Like in Microsoft Excel, Microsoft Word provides the capability of creating a chart or graph and adding to your document. To create and insert a chart or graph directly in Microsoft Word, follow the steps below.
- Open the Microsoft Word program.
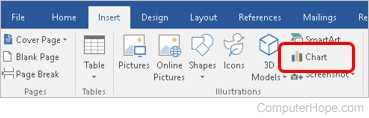
- In the Ribbon bar at the top, click the Insert tab.
- In the Illustrations section, click the Chart option.
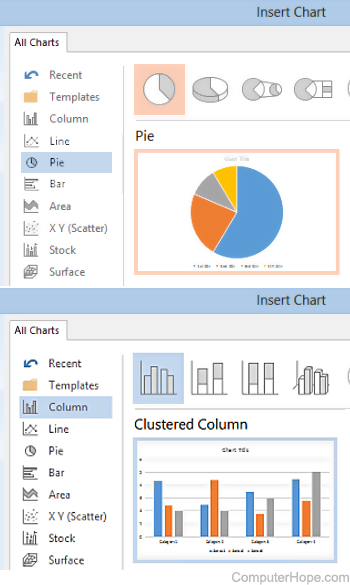
- Once the Insert Chart window is open, select the type of chart or graph you want to create, and then click the OK button.
- A basic version of the selected chart or graph type, with sample data, is added to the document. A Chart in Microsoft Word window also opens, which looks like a Microsoft Excel spreadsheet. In the spreadsheet window, add, remove, or modify the columns and rows of data to include the data points and values you want your chart to display.
- As you modify the columns, rows, and values in the spreadsheet window, the chart or graph in Microsoft Word automatically updates and display the new or changed data.
- When finished modifying the chart, close the spreadsheet window.
If you need to update the chart data after closing the spreadsheet window, you can re-open the spreadsheet window by right-clicking the chart and selecting the Edit Data option.
Create chart or graph in Microsoft Excel and copy to Microsoft Word
Microsoft Excel provides more functionality and data manipulation capabilities than Microsoft Word provides when creating a chart or graph. If you need the increased capabilities of Excel to create a chart or graph, and then put it in a Microsoft Word document, follow the steps below.
- Open the Microsoft Excel and Microsoft Word programs.
- Create the chart or graph in Microsoft Excel.
- After the chart or graph is created and ready to be placed in the Word document, select the entire chart in Excel.
- Right-click the chart or graph and select the Copy option. You can also press Ctrl+C on your keyboard to copy the chart or graph.
- In the Word document, place your mouse cursor where you want to add the chart or graph.
- Right-click and select the Paste option to place the chart or graph in the document. You can also press Ctrl+V on your keyboard to paste the chart or graph.
Using the process above, you cannot modify the chart or graph through Microsoft Word after placing it in the document.