
How to add, modify, and remove a chart in PowerPoint
Adding a chart to a slide in Microsoft PowerPoint can enhance the visual appeal of a presentation. A chart helps illustrate data, showing trends or changes in data over time, helping to explain an important topic in the presentation.
To add, modify, or remove a chart from a PowerPoint slide, select a link below and follow the instructions.
Add a chart to a PowerPoint slide
To add a chart to a slide in your PowerPoint presentation, follow the steps below.
- Open a new or existing PowerPoint presentation.
- Go to the slide where you want to add a chart.
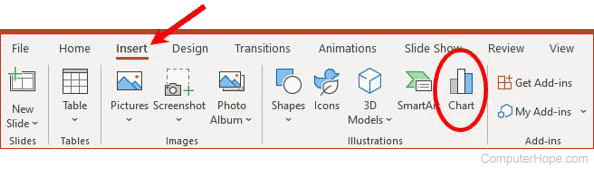
- Click anywhere in that slide, and in the Ribbon, click the Insert tab and select Chart.
- In the Insert Chart window, select the type of chart you want to add, and then click OK.
- The selected type of chart is added to your slide, including sample data. The data used to build the chart is displayed in the Chart in Microsoft PowerPoint window, which looks like an Excel spreadsheet. In that window, add your chart data, and change the names of the data points, if applicable.
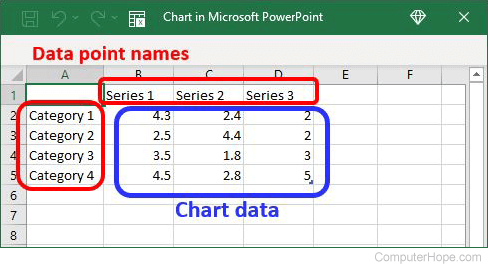
As you add chart data in the Chart in Microsoft PowerPoint window, the chart in the slide is automatically updated.
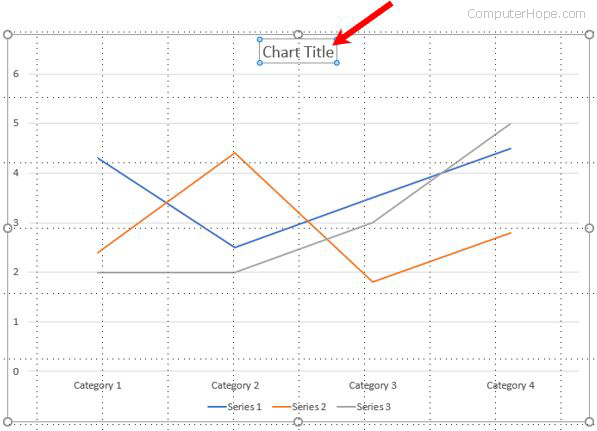
- In the chart, click the Chart Title text and change it to a more meaningful title for your chart. You can also delete the Chart Title text, if you don't want a title displayed.
Modify a chart in a PowerPoint slide
To modify an existing chart in a PowerPoint slide, follow the steps below.
- Open the existing PowerPoint presentation, select the slide containing the chart, and then click the chart to select it.
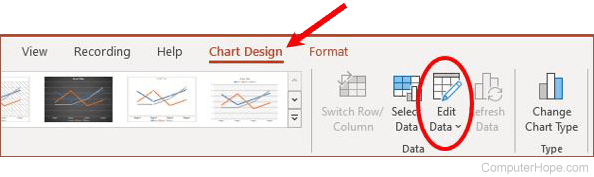
- In the Ribbon, click the Chart Design tab, and then click the Edit Data option.
- The Chart in Microsoft PowerPoint opens, allowing you to change the chart data and the data point names, as needed. As you make changes to the data, the chart in the slide is automatically updated.
- To change the chart's title, click the chart title text and change it, as desired. You can also delete the chart title if you don't want a title displayed.
Remove a chart from a PowerPoint slide
To remove a chart from a slide in your PowerPoint presentation, follow the steps below.
- Open the existing PowerPoint presentation, select the slide containing the chart, and then click the chart to select it.
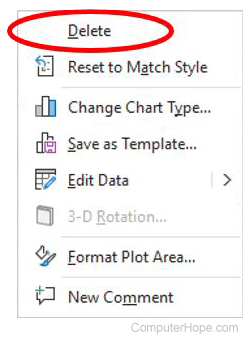
- Right-click the chart and select Delete in the pop-up menu.
With the chart selected, you can also press the Delete key to remove the chart.